
How warming is flying anyway?
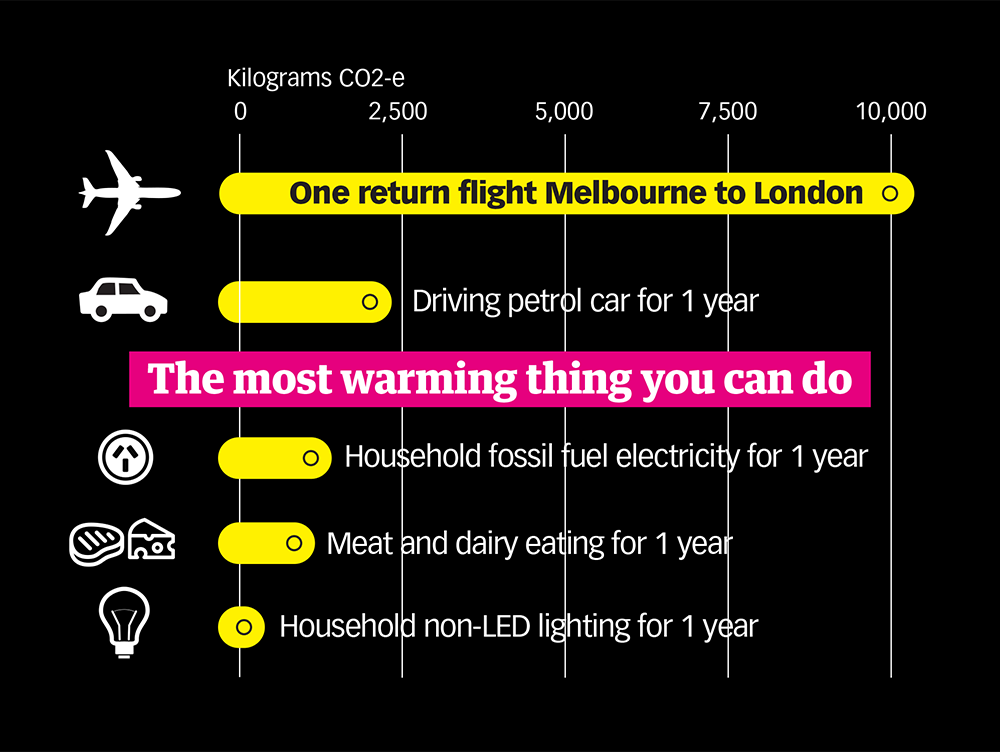
Flying is the most warming single thing you can do.
Emissions from jet planes high in the atmosphere have a warming effect that dwarfs that from the same amount of fuel burnt on the ground. Flying is the most warming way to get around.
……………
Emissions from jet planes high in the atmosphere have a warming effect that dwarfs that from the same amount of fuel burnt on the ground.
Emissions from the burning of a jet engine’s fuel include carbon dioxide (CO2), nitrogen oxides (NOx), water vapor (H2O), hydrocarbons, sulfur oxides (SOx), and black carbon (soot).
These gases and particles interact at cruising altitude in the upper troposphere and lower stratosphere in different ways to that at ground level, altering the concentration of atmospheric greenhouse gases. Ozone (O3) forms from NOx, and condensation trails, or contrails, form when water vapor condenses rapidly into tiny water droplets that freeze as millions of ice crystals. Both ozone and contrails prevent heat from escaping the atmosphere, and add to the global warming effect.
All these emissions affect global warming either directly (CO2) or indirectly (NOx, SOx, black carbon); by known (CO2) or inexact (NOx, H2O) amounts; and either briefly (NOx, H2O) or for decades (CO2).
Radiative forcing is a measure of global warming. It’s the difference between the sunlight energy absorbed by the Earth and the energy radiated back to space. Greenhouse gases cause radiative forcing, altering the Earth’s radiative equilibrium by increasing the temperature of the climate system.
The Radiative Forcing Index (RFI) is the ratio of total radiative forcing to that from CO2 emissions alone. It is a measure of aircraft-induced climate change other than that from the release of fossil carbon alone.
As stated by the IPCC already in 1999, persistent contrails and aviation induced cirrus (AIC), as well as NOx derivatives, although short-lived, contribute significantly more to global heating than aircraft CO2 emissions alone. Aviation’s contribution to today‘s global heating, measured as Radiative Forcing (RF)³ from 1750 until today, has been estimated by the IPCC and the estimate is regularly updated by academic researchers. The International Panel on Climate Change Special Report on Aviation in 1999 estimated an RFI range for aviation emissions of 2 to 4, with a best estimate of 2.7. And the IPCC Fourth Assessment Report in 2007 reported it as ranging between 1.9 and 4.7.
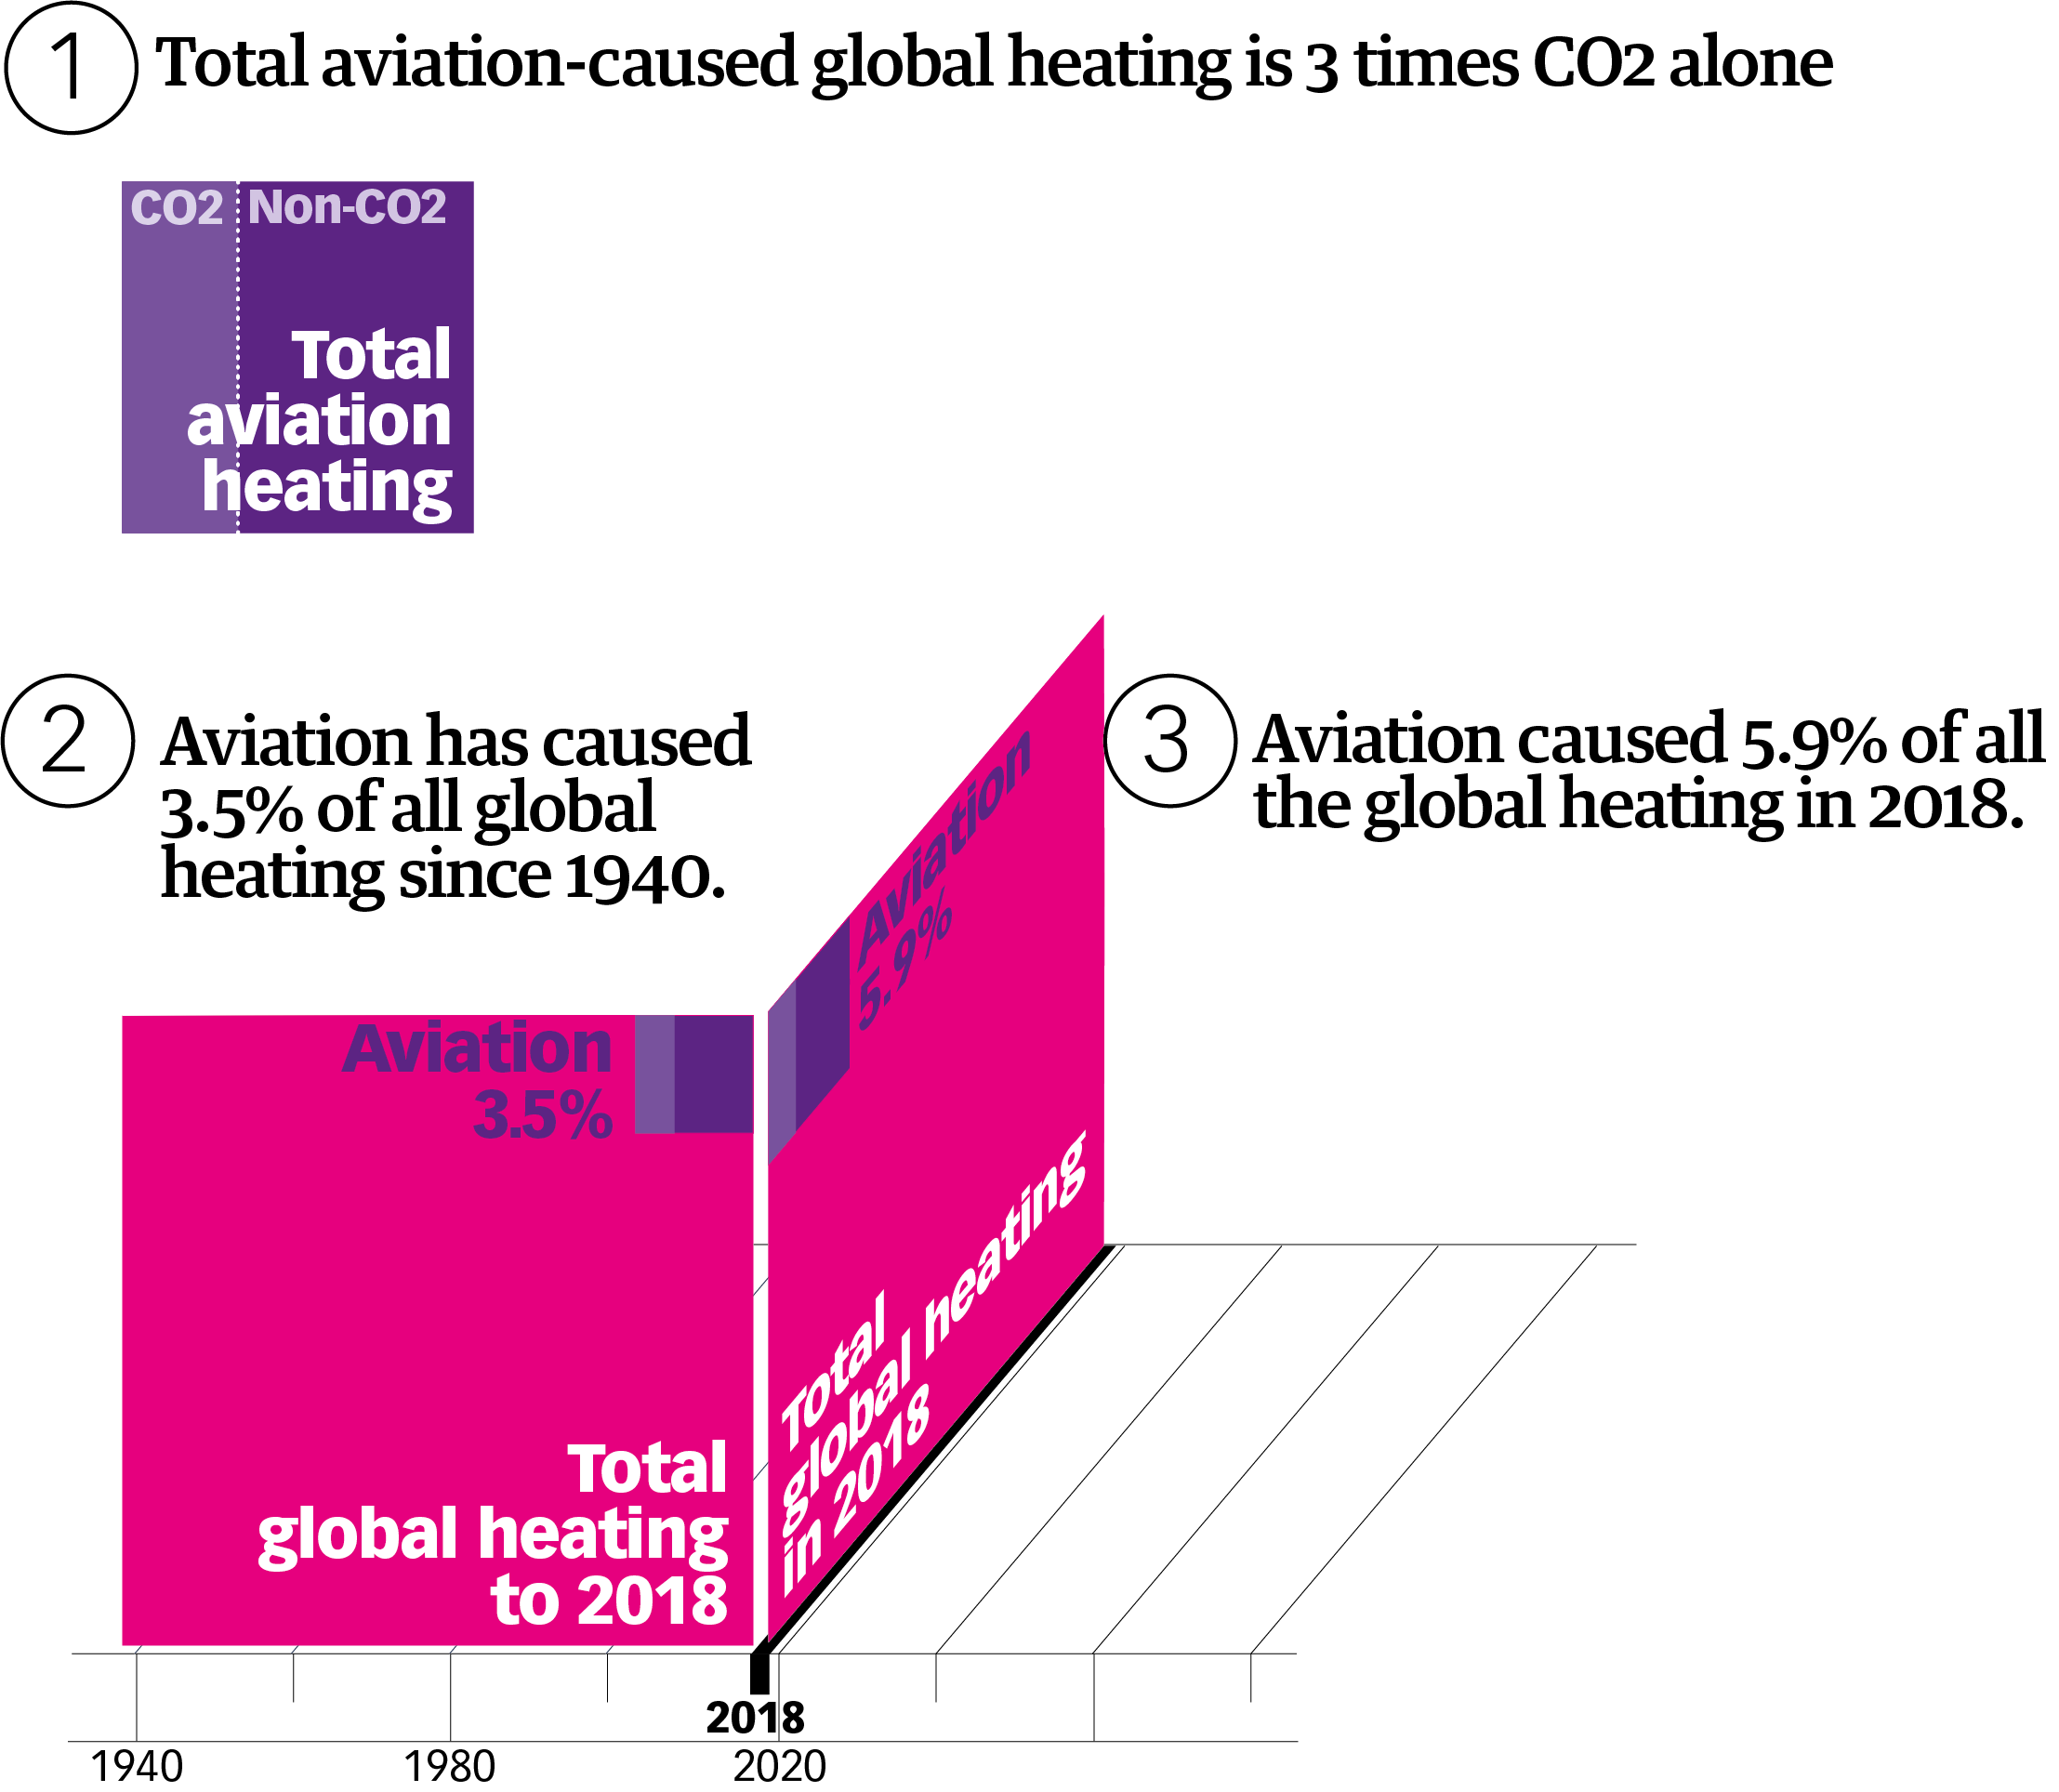
In September 2020, 21 scientists prominent in the field published a reassessment taking into account the Effective Radiative Forcing (ERF) of non-CO2 components. Their study, “The contribution of global aviation to anthropogenic climate forcing for 2000 to 2018”, concludes that the total global heating impact of aviation is about 3 times greater than the global heating impact of CO2 alone, as in, one third from CO2 and two thirds from non-CO2. Furthermore, this Effective Radiative Forcing caused by the accumulated CO2 together with the short-lived non-CO2 components which reappear everyday that flights continue, has contributed about 3.5% to the total anthropogenic global heating since 1940, when aviation began in earnest.
A Fact Sheet “It’s about more than just CO2 – Aviation must reduce its total impact on climate”, and a presentation “The real climate impact of aviation” prepared by Stay Grounded after the publication of the paper just cited, highlights these two points: aviation’s total climate impact is 3 times that of its CO2 alone; and to date aviation’s contribution to total global heating has been 3.5%. Also drawing from the work in the above study, the Fact Sheet points out that aviation’s contribution to global heating in 2018 was 5.9%.

Based on Transport modes chart by Barry Saxifrage of VisualCarbon.org and NationalObserver.com, January 2016. Sources: Bus — average USA intercity coach data from Motorcoach Census 2011. Train — Amtrak USA average from Amtrak Sustainability Report 2013. Via Rail from 2014 annual report. Driving — USA average of 1.8 people per car for trips over 100 miles from US Department of Transport (DOT). Embodied emissions included of 20 gCO2/km for gas cars and 40 gCO2/km for EVs. Electric vehicles — Tesla S or other EV that uses 34kwh/100 miles according to www.fueleconomy.gov. Electricity sources in gCO2/kwh: Clean = 20 (similar to VT, BC or Quebec). Canada E average = 160. USA e average = 534 (similar to natural gas) Dirty = 820 (like Utah or Alberta). Petrol cars — Hybrid = Prius EPA rating. Motorcycle, car and SUV = USA averages according to DOT Annual Vehicle Distance Travelled dataset. Plane — Emissions by class are industry averages from atmosfair.de flight carbon calculator based on 3,600 km round trip. This includes all climate impacts including NOx and water vapour impacts using IPCC best estimate of 2.7 x CO2 alone. Range of most and least fuel efficient airlines comes from ICCT occupancy from IATA annual report 2013. Executive jet is based on Gulfstream G280 specs of maximum distance/maximum fuel and maximum occupancy of 10 passengers.
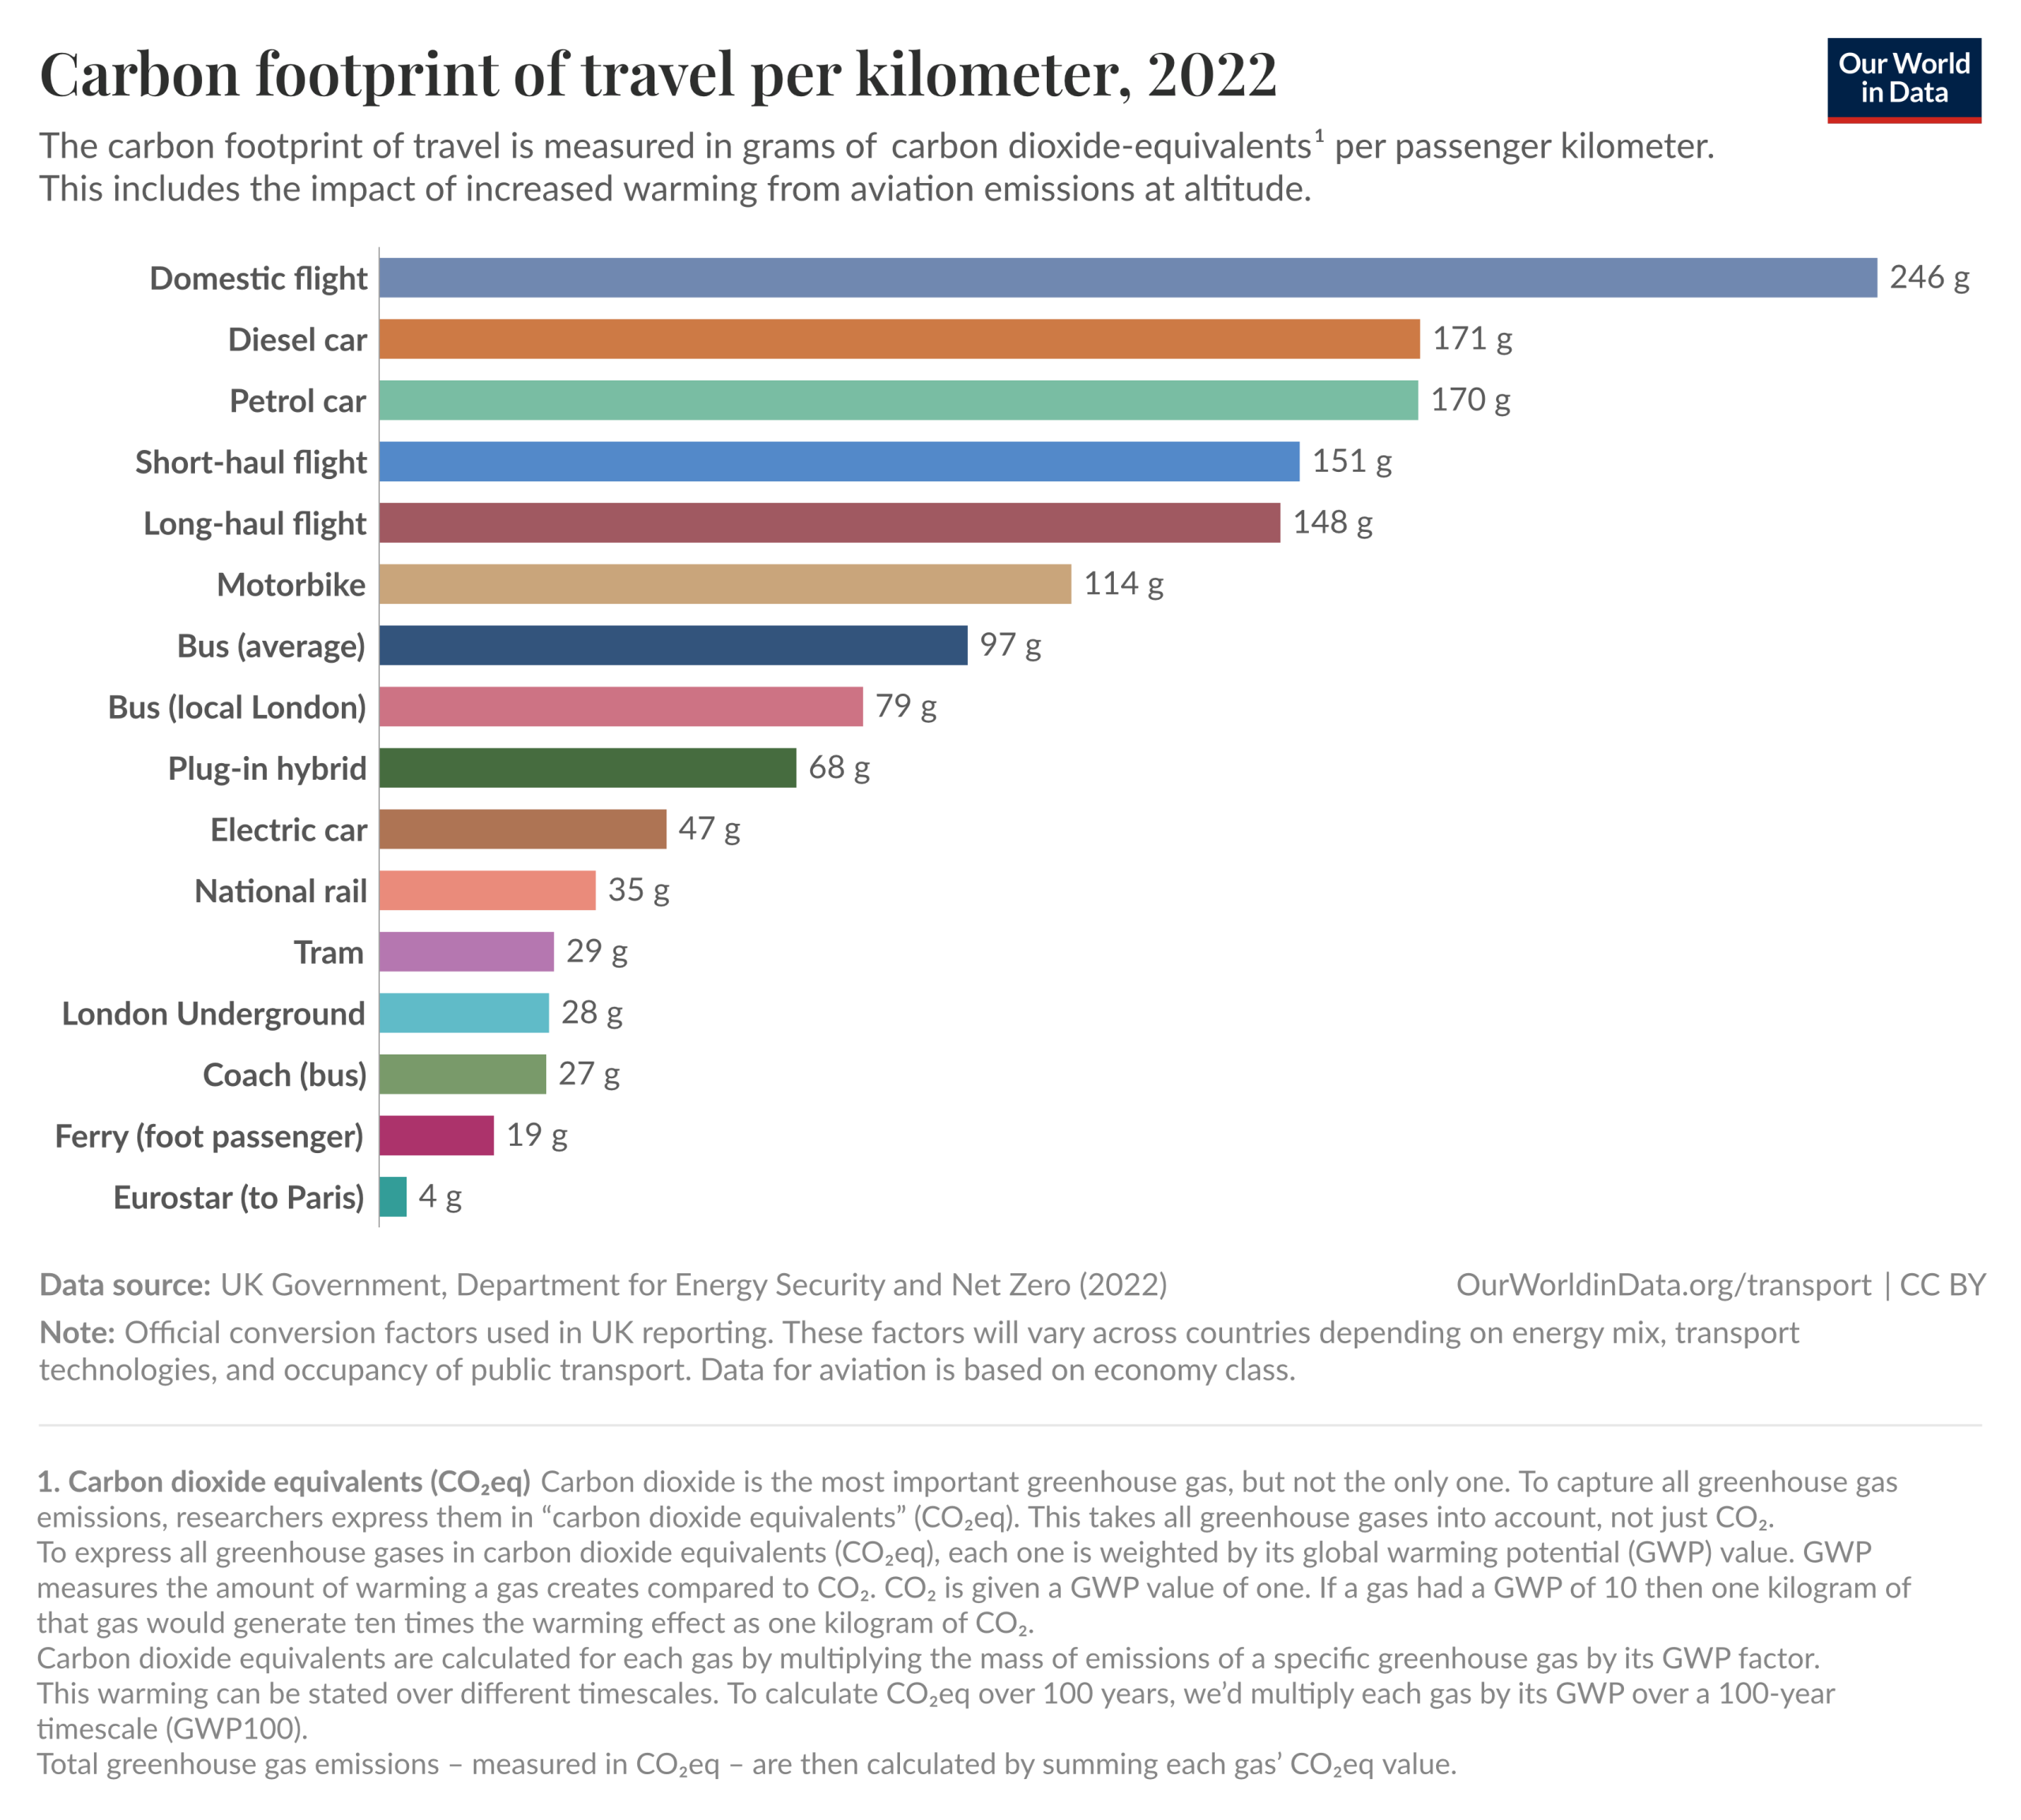
See the PDF “Emissions by Mode” for further comparative figures, both for CO2-e emissions (prepared by the Tyndall Centre for Climate Change Research) and for CO2 emissions (prepared by the IPCC, the Climate Council, and the European Union).
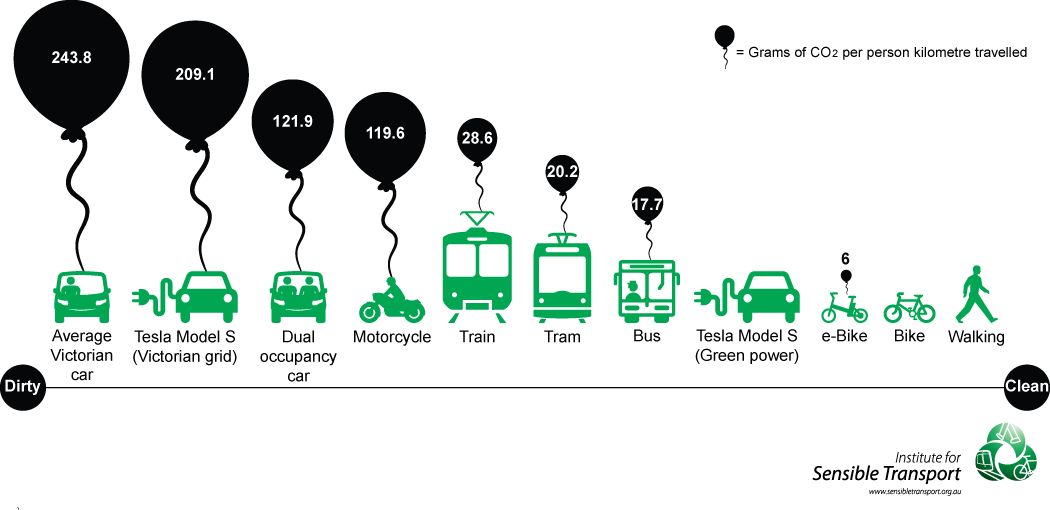
Another set of comparative figures for grams of CO2 per person kilometre travelled, this time for just cars, bikes and public transport, (see below) is presented on the website of The Institute for Sensible Transport.
Go to Flight emissions calculations to find out about the contribution to warming of individual flights.

Tourism is the major reason we fly. Of the 5% of the world’s population that have ever flown, Australians are amongst the most frequent flyers. Mostly we fly for holidays, and more and more.Short-term Australian resident departures 2002 to 2012.
We look forward to experiencing other cultures and experiencing what the travel industry loves to promote as “exotic” locations. Tourist numbers are growing. In 2017 the UN counted 1.3 billion international arrivals — an increase of 8% in European arrivals. In 2016 in Asia arrivals increased 9%.
But the package is no longer what it’s cracked up to be. Even from the get-go. As the planet warms, air travel will become bumpier, and severe storms that ground aircraft will become more frequent, as will extreme heatwaves making it too hot for safe aircraft use. There will be no thrill in joining the growing crush of tourists on St Marks bridge in Venice, or in staying in an Airbnb in Barcelona and many other cities, where the “sharing” accommodation economy and rising rents have driven the local people and urban culture out of the inner-city. What pleasure will there be in holidaying in a hurricane-devastated Florida, in taking that trade trip to China only to land in a flooded Guangdong, or visiting the Philipines, sitting there in Asia’s cyclone disaster alley? Air travel emissions will help drown the Maldives, Tuvalu and hundreds of tourist destinations this century.
Even Australian tourism destinations are at risk from rising sea levels, including Fremantle, Port Douglas, Noosa, Byron Bay, and the Gold Coast, as well as Sydney and Hobart airports. Scientists at the not-for-profit organisation Climate Central estimate that 275 million people worldwide live in areas that will eventually be flooded at 3°C of global warming.
By 2100, chronic flooding will be occurring in the United States from Maine to Texas and along parts of the west coast including Oakland, California. It will affect as many as 670 coastal communities, including Cambridge Massachusetts, Miami and St Petersburg Florida, and four of New York City’s five boroughs.
A recent study reported that “between 2009 and 2013, tourism’s global carbon footprint [excluding non-CO2 emissions such as contrails] has increased from 3.9 to 4.5gT CO2-e, four times more than previously estimated, accounting for about 8% of global greenhouse gas emissions … Driven by the desire for exotic travel experiences and an increasing reliance on aviation and luxury amenities, affluence has turned tourism into a carbon-intensive consumption category. Global demand for tourism is outstripping the decarbonisation of tourism operations, and, as a result, is accelerating global carbon emissions.”